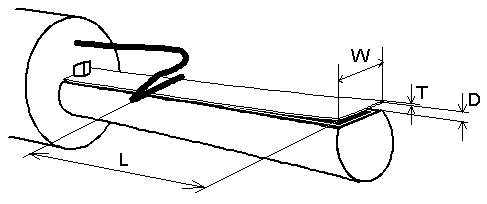
Fig 1. Measures in the tongue-shallot region of a reed pipe.
About a number of proportionalities
relevant as a guide to
the
dimensioning of a reed pipe tongue. The underlying theory is from basic
physical laws that can be used to find proportionalities. Supplementing
empirical data establish approximate values for the proportionality
constants.

Fig 1. Measures in the tongue-shallot region of a reed pipe.
Assume the tongue to be a rectangular plate of thickness T, width W, and free oscillating length L. The material in the tongue has a density R and a Young's modulus E. We propose to blow it with an air pressure P and then want it to oscillate at a frequency F.
The tongue volume and the material density render the mass of the
oscillating
part of the tongue
M
=
(const)*T*W*L*R
[meter3*kilograms/meter3 = kilograms].
The effective mass that will actually oscillate is smaller than volume
times density. The tip of the tongue will contribute fully, but the
fixed
end not. We need not go into the theoretical details of this, or for
instance
whether the deformation shape of the tongue is circular, parabolic, or
whatever. Instead we assume that this deformation shape is always the
same,
proportionately scaled to the tongue dimensions and its momentary
deflection.
Then the effective oscillating mass is always a fixed fraction of the
total
mass and we can eventually find out empirically how big the constant
is.
Applying the wind pressure will impose a force G on the flat surface
of the tongue:
G
=
W*L*P
[meter2 * newton/meter2 = newton]
and this will cause a certain tongue tip deflection D [meter].
Arbitrarily
we can assign a nominal value for D
equal to the gap at rest between
tongue
and shallot at the tip. This is not necessarily the same as the actual
static deflection under pressure - any deviation from this will be
included
in the empirical proportionality constants later.
From the theory of bending beams we can find a general connection
between
force and deflection, namely the stiffness
K
= G/D = (const)*E*W*(T/L)3
[newton/meter]
Again we need not bother about the constant, but note that stiffness
increases in proportion to the material property E and to the width W
of
the tongue. Increasing thickness T
or decreasing length L will
increase
stiffness very considerably because these are both raised to the third
power.
Combining the mass and stiffness expressions we arrive at a formula
for the resonance frequency of the tongue
F
= sqrt(K/M)/(2*π) =
(const)*sqrt(E/R)*T/L2
[hertz]
The material specific quantity sqrt(E/R)
is actually the speed of sound
travelling along a bar and differs fairly little between those
materials
that can come in question. For brass it is about 3500, steel 5000, and
aluminium 5100 meters/second. The temper state of the material, hard
hammered
or soft annealed, has a negligible influence on the frequency but is
obviously
important for the tongue to stay in shape under more severe mechanical
stress, for instance during assembly.
This formula for frequency is one foundation to select thickness and length for the tongue, it tells a relation between them but gives no absolute measure. For instance making a tongue twice as long and four times thicker will keep the same resonance frequency. But where to start?
Let us postulate that when we apply the blowing pressure P, then the
deflection D shall always be
proportional to the length L.
In other
words,
apart from magnitude scale, the shape of the tongue is always to be the
same. Then we get from the G
and K expressions, inserting D=(const)*L,
that
G/D
= (const)*W*L*P/L =
(const)*E*W*(T/L)3
[newton/meter]
or
P
= (const)*E*(T/L)3
[pascal]
Here we have a second foundation, a different relation between T and
L as compared to that of the
frequency formula. This one tells us that
for a given pressure P there
is a rather critical requirement on the
ratio
T/L. It is raised to the third
power meaning that if we for instance
keep
L and make T twice as thick, then the pressure
must be increased 8
times
(while the frequency F will
then increase to only twice the original).
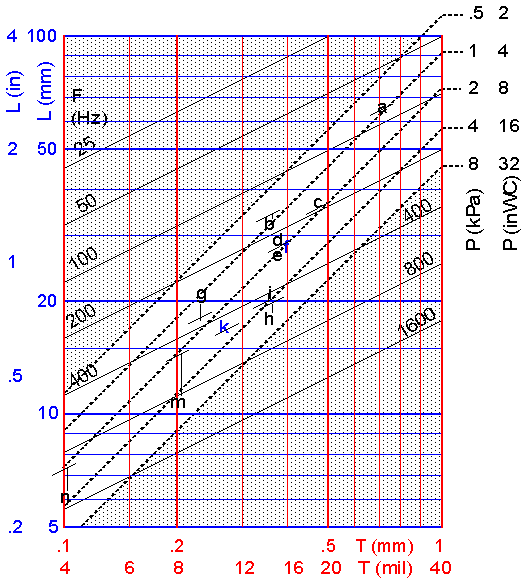
The implications of these formulas are condensed in fig 2. Its axes are for thickness T horizontally and length L vertically, both on logarithmic scales. The frequency formula is represented by a set of moderately sloping lines having constant T/L2, marked with frequency in Hertz. The pressure formula gives the dashed lines at 45 degrees angle. The slopes and the mutual distances in these sets of lines are direct consequences of the formulas. Remains their absolute positions, the specific values of the proportionality constants - this is where the empirical data enters.
| Design | D | T | L | Wtip | Wwire | F | Pstart | Remark |
| mm | mm | mm | mm | mm | Hz | kPa | ||
| a | 1.9 | 0.70 | 64 | 17.0 | 17.0 | 93 | 0.9 | |
| b | 1.4 | 0.35 | 31 | 11.0 | 8.5 | 156 | 1.2 | |
| c | 1.0 | 0.47 | 37 | 14.5 | 14.5 | 196 | 0.8 | |
| d | 1.5 | 0.37 | 29 | 12.0 | 8.0 | 250 | 1.0 | |
| e | 0.8 | 0.37 | 26 | 12.0 | 8.0 | 250 | 1.0 | e = d |
| f | 1.2 | 0.75>0.39 | 47>28 | 12.0 | 7.0 | 250 | 1.0 | Duralumin |
| g | 0.8 | 0.23 | 21 | 12.0 | 12.0 | 370 | 0.7 | |
| h | 0.5 | 0.35 | 18 | 7.0 | 6.0 | 450 | 1.0 | |
| i | 0.5 | 0.35 | 21 | 7.0 | 5.0 | 470 | 1.3 | |
| k | 1.4 | 0.25>0.27 | 20>17 | 8.0 | 8.0 | 510 | 1.7 | Steel |
| m | 0.5 | 0.2 | 11 | 6.8 | 6.0 | 523 | 0.9 | |
| n | 0.4 | 0.10 | 6 | 3.5 | 3.5 | 1010 | 2.2 |
For each the L and T coordinates are marked with its designator in fig 2, and this is joined to a little oblique bar telling what frequency actually resulted. The (vertical) location of the set of frequency lines has been adapted to match these data as well as reasonably possible - ideally the bars and letters should coincide. All those pipes were meant to be blown at 2 kPa (8 in WC) pressure, hence the positioning of the pressure line set. One of the tongues is steel, one duralumin, the others brass, three of them moderately wider at the tip, but neither distinguish themselves notably in the diagram.

Fig 2. Finding frequency and pressure constants for given tongue
dimensions. Marks denote empirical examples.
Naturally the empirical data points do not match the frequency and pressure lines perfectly, but their clustering close to the 2 kPa diagonal can be taken as a fair verification of the theoretical expectations.
One observation in the diagram is that for a requested frequency and pressure you can use only a very limited range of tongue length and thickness, in practice you will probably have to stay within the white diagonal area. Judging from the pressure lines it is obvious that if you make the tongue too long as to enter the upper shaded area then the tongue may close and stay shut. In the lower shaded area the tongue is too stiff such that the air pressure is not enough to agitate it.
It should be noted that the measurement of length L is basically very uncertain. Nominally this is from the tip of the tongue to the tuning wire, but the length that is effective in a particular case depends very much on the precise curve the voicer has succeeded to give the tongue. There are a number of other factors that also have their influence on the reed behaviour. Additional to the tongue material there is for instance whether the shallot is leathered or not, or if the width of the tongue varies somewhat lengthwise, if D is in proportion, and the frequency pulling effect from the pipe resonator. It appears that all those factors can be grossly neglected, they typically may modify the tongue frequency several semitones from the diagram prediction. This is however overshadowed and easily compensated for by even a moderate change in length, which as said is anyway critically dependent on tongue curvature.

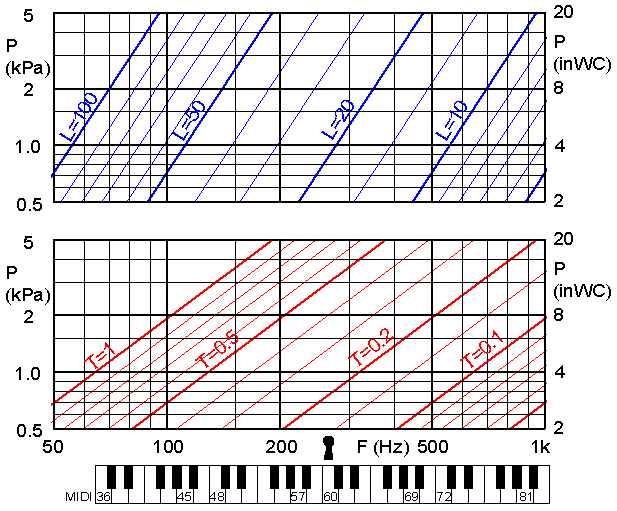
Fig 3. Diagram to find required length L and thickness T in mm for
a brass tongue, at blowing pressure P and frequency F.
Example: For a tongue to oscillate at 200 Hz at 2 kPa pressure its length L should be 37 mm and thickness T 0.5 mm.
| Material | E (GPa) | R (Mg/m3) | FL | FT |
| Brass | 104 | 8.5 | 1 | 1 |
| Steel | 200 | 7.7 | 1.17 | 0.94 |
| Alumin | 70 | 2.7 | 1.66 | 1.90 |
| Bamboo | 10 | 0.5 | 2.79 | 6.09 |
| Spruce | 15 | 0.5 | 2.99 | 5.69 |
For steel you should multiply L by 1.17 and T by 0.94, close enough to unity you may neglect it. For aluminium, multiply L by 1.66 and T by 1.90. Assuming constant shape this would also imply a larger D such that supply as well as acoustic power should more than double when switching to an aluminium tongue. Experiment showed this is indeed true, item f in tab1 sounds about 5 dB stronger than e. But there is no sound level difference between d and f, d being identically the same tongue as e, but with a different curve.
Bamboo and spruce are materials with an extreme ratio between E and R, comparable only to carbon fiber composites. Even if they are no serious candidates for an organ pipe tongue the table illustrates their potential for high sound level. And that there is a reason you do not use metal reeds in the orchestra woodwinds where bamboo is normal. That would have lowered the output sound power substantially.