Organ pipe sensitivity to pressure

Johan Liljencrants


The frequency (pitch) of a speaking organ pipe is basically defined by its resonator. Most simply this is characterized by its length, while a more detailed analysis would include influences from temperature, tube end correction and mouth cutup. Also intonation devices like ears and brakes give their share.

This experiment gives examples on how pitch and sound level change as functions of blowing pressure. Such variation is a fact known to everybody in the field, but quantity is little covered in the literature. Usually this aspect is left to the pipe voicer who has to cut and try to finalize the pipe to work at a specified pressure. After that attention is focussed on minimizing pressure effects with regulators and liberal air ducting. An opposing interest comes when you use a tremulant in the supply to deliberately induce a vibrato. To tune the pressure modulation depth one should then know how different pipe ranks react to pressure changes.

Also another static consequence is interesting, namely how an organ may go out of tune from a temperature change. Here you might compare thermal detuning to how much of a blowing pressure change would give a similar effect.

Measurements

Seven pipes were examined, all for the pitch a' = 440 Hz. The majority of them come from the JoLi organ, including two reed pipes. A Wurlitzer Tibia was taken as a contrasting object. This loud theatre organ pipe is rather wide, has a high cutup, and uses much air.

Air supply was taken from a vacuum cleaner where speed was set with a variable transformer to give the desired pressures, monitored with a transducer at the pipe toe. The pressure range used was adapted to what each individual pipe could handle to produce a steady tone in its basic mode. Pitch was measured to single cent accuracy with a Peterson 590 Autostrobe tuner. Sound pressure level was taken with a level meter about 2 ft away from the pipe. These level data are not very accurate since they were taken in an acoustically untreated lab, however while trying to keep environment the same over each pressure scan. The measurements were collected and processed in an Excel spreadsheet.

Result plots

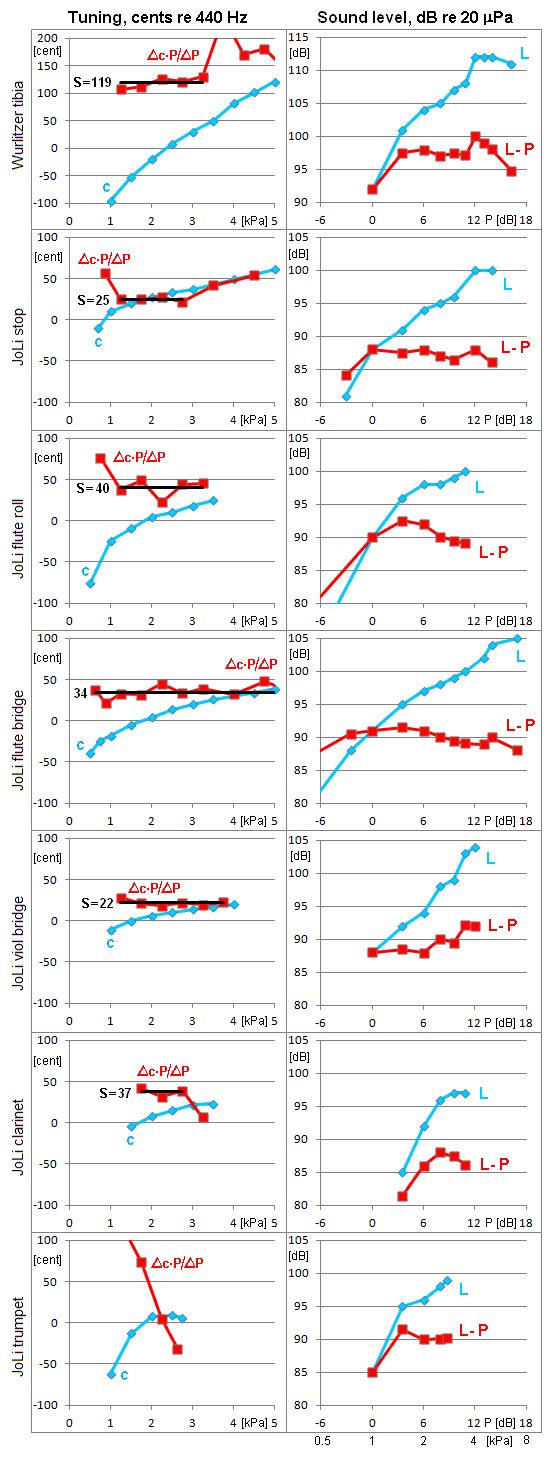
The horizontal scale in all the graphs of fig 1 is blowing pressure P, at right in dB re 1 kPa. The vertical scales are logarithmic. The left set is deviation in cents from the nominal 440 Hz pitch while the right set shows sound pressure level in dB re 20 μPa. The blue traces are measured data, the red ones are derivations to show the interesting outcome of the measurements.

file:///C:/Documents%20and%20Settings/JoLi/My%20Documents/FonWeb/pipref/pipstiff.gif  

Stoppered flue

L 150
W 31
H 16
D1,2

S=119

Stoppered flue

L185
W16
H 11
D 0,35

S=25
Open flue

L 325
W 24
H 11
D 0.45

S=40

Open flue

L 307
W 24
H 10
D 0,35

S=34

Open flue

L 352
W 16
H 7
D 0,5

S=22

Reed, cylindrical

L 175
W 25
Lt 23
D 1,0

S=37

Reed, flared

L 300
Wm 40
Lt 14
D 0,7

S=?


Fig 1. Measurements of pitch and sound level vs. blowing pressure for different pipes, all nominally for pitch a'=440 Hz, 0 cents in the left set of graphs. The horizontal pressure scale is linear in the left set, logarithmic in the right set, expressed in dB re 1 kPa. Correspomding pressure values are shown at the extreme bottom.
The column at right lists pipe measures in mm: length L, width W, cutup H, flue D, tongue length Lt, mouth width Wm.

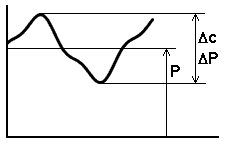
The left set of graphs shows pitch c in terms of cents relative to a' = 440 Hz, 100 cents = 1 semitone. The cents measure is a relative quantity, it describes the pitch relative to the nominal pitch of the pipe. A natural thing would now be to compare this to relative changes in blowing pressure. Thus for each measured pair of points P1/c1, P2/c2 first take the cents difference
Δc = c2-c1. Then suppose this is S times the relative blowing pressure difference (absolute difference divided by mean value)
ΔP/P = 2*(P2-P1)/(P1+P2). This leaves us with what we may call the

 pitch pressure sensitivity  S = Δc * P / ΔP
The values of S found from consecutive data pairs are shown by the red traces in fig 1, left section. These prove that this definition of S is sound, since we for each pipe get essentially the same values of S over the useful pressure range. This is shown with a horizontal black bar together with that average value of S. The reed trumpet however behaves more irregularly.

A practical use is to relate a trem modulated pressure to the pitch modulation. Suppose for example we have 12 inWC pressure where the trem modulates it to the depth 3 inWC peak to peak. Then ΔP/P = 3/12 = 0,25 and using the Tibia pipe with S = 119 we can expect the pitch modulation swing to be Δc = S * ΔP/P = 119*0,25 =  30 cents
pipdlt.gif
Fig 2. Measures in a time varying pressure or pitch graph.

In the right set of fig 1 the red traces show that sound and blowing pressures are roughly proportional, which should be no surprise. For some pipes the blue graphs flatten out toward high pressures, most probably due to relatively increasing turbulence losses.

As a sideline we note that the reference sound pressure of the vertical axis is the usual one in acoustics, namely 20 μPa while blowing pressure was given with 1 kPa reference. These differ by 154 dB. In fig 1 most pipes show L-P about 90 dB. So to compare sound and blowing pressure on a common scale would mean that sound pressure is in the range -64 dB relative to blowing pressure.

Discussion

The Tibia pipe stands out against the others in that its pitch is much more pressure sensitive. The explanation is not self evident, but is related to the combination of wide apertures at all significant places like cross section, mouth, and flue.

Together with its loud output with little of harmonics this property has made the Tibia be a filler backbone rank in theatre organs and carrier of their characteristic heavy tremolo.

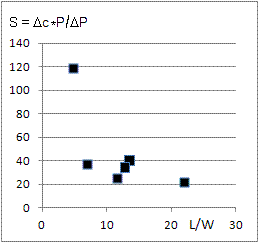
Fig 3 shows pitch sensitivity against the pipe scale in terms of length/width. It stands out that the narrower is a pipe, the better it will keep pitch.

It may be interesting to compare the discussed detuning effect from blowing pressure to what happens as sound speed changes with temperature.  In dry air the pitch of flue pipes will rise with temperature 3 cents per centigrade. To get that much of a detuning from a pressure change with S = 30 would require ΔP/P = Δc / S = 3/30 = 10%. Generally organ supply is much more stable than that.
 
pipslim.gifFig 3. Sensitivity of pitch in cents per relative pressure change versus 'skinniness', the scale of length/width.


JLs 2011-10-30